

Return on Ad Spend (ROAS) measures how much revenue you earn for every dollar spent on advertising. Calculated as Revenue ÷ Ad Spend, ROAS helps marketers allocate budgets, evaluate campaign performance, and drive smarter decisions across all types of digital marketing and digital media channels.
Advertising budgets are under more scrutiny than ever. Whether you’re running a lean startup or managing a large enterprise, every dollar you put into paid media needs to work harder. That’s exactly why Return on Ad Spend (ROAS) has become one of the most closely watched metrics in digital marketing.
But ROAS is often misunderstood. Many marketers track it in isolation, celebrate high numbers without context, or confuse it with related metrics like ROI or Customer Acquisition Cost (CAC). The result? Budgets that look efficient on paper but quietly underperform in practice.
This guide breaks down everything you need to know about Return on Ad Spend (ROAS)—how to calculate it, how to benchmark it, how it interacts with Customer Lifetime Value (CLV) and Customer Acquisition Cost (CAC), and how to apply it across different types of digital marketing and digital media. By the end, you’ll have a clear, actionable framework for using ROAS to sharpen your marketing strategy and protect your bottom line.
What is Return on Ad Spend (ROAS)?
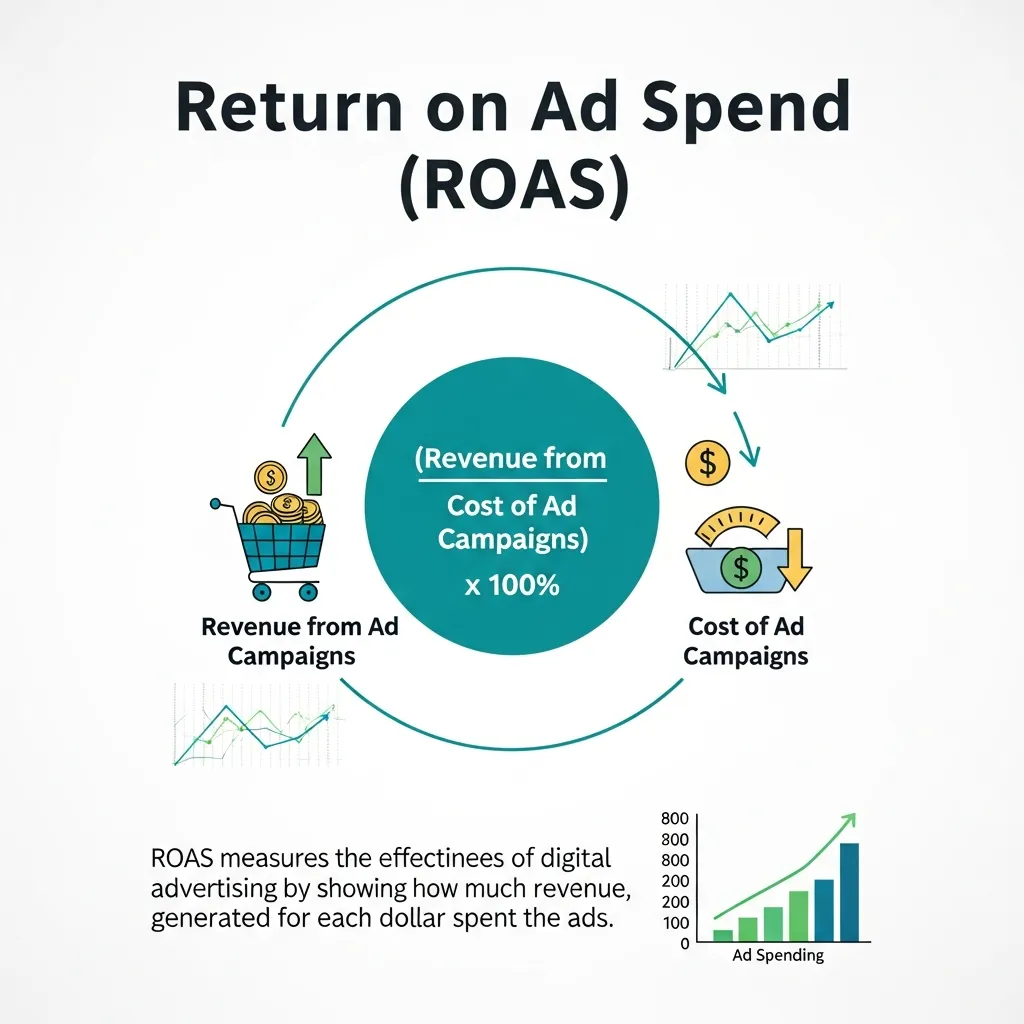
Return on Ad Spend (ROAS) is a marketing metric that quantifies the revenue generated for every dollar spent on advertising. It provides a direct, real-time measure of campaign efficiency.
The ROAS formula is straightforward:
ROAS = Revenue Generated from Ads ÷ Ad Spend
For example, if a campaign generates $10,000 in revenue from a $2,000 ad spend, the ROAS is 5:1—meaning you earned $5 for every $1 spent.
How does Return on Ad Spend differ from ROI?
While both metrics assess marketing effectiveness, they measure different things. Return on Ad Spend (ROAS) focuses purely on ad revenue versus ad spend. ROI (Return on Investment), by contrast, accounts for all associated costs—production, overhead, agency fees, and more. This makes ROI a broader profitability measure, while ROAS is a more surgical tool for evaluating specific campaigns or ad groups.
Why does Return on Ad Spend matter for business decision-making?
ROAS gives marketers and business leaders a fast, scalable signal for where advertising dollars are performing and where they’re not. High ROAS on one channel can justify increased investment. Low ROAS on another signals a need for creative overhaul, audience refinement, or budget reallocation. Used consistently, Return on Ad Spend (ROAS) transforms gut-feel decisions into data-driven strategy.
Return on Ad Spend vs. Related Marketing Metrics
ROAS vs. Customer Acquisition Cost (CAC)
Customer Acquisition Cost (CAC) measures how much it costs to acquire one new customer. While Return on Ad Spend (ROAS) looks at revenue generated, CAC focuses on spending efficiency at the customer level. A campaign can have a strong ROAS but a high CAC if it generates revenue from low-value, high-frequency purchases rather than meaningful new customer relationships.
Tracking both metrics together reveals the full picture. If your ROAS is healthy but CAC is climbing, that’s an early warning sign—often indicating audience saturation, ad fatigue, or poor targeting.
ROAS vs. Customer Lifetime Value (CLV)
Customer Lifetime Value (CLV) represents the total revenue a business can expect from a single customer over the entire relationship. This is where Return on Ad Spend (ROAS) benchmarks can become misleading. A campaign with a ROAS of 2:1 might seem underperforming at first glance. But if the customers acquired have a high CLV—say, they subscribe for three years or make repeat high-value purchases—that 2:1 ROAS could be enormously profitable long-term.
Smart marketers factor Customer Lifetime Value (CLV) into their ROAS targets. Rather than chasing the highest possible short-term return, they set ROAS thresholds that align with long-term profitability.
Understanding the relationship between ROAS, CAC, and CLV
Think of these three metrics as a triangle. Return on Ad Spend (ROAS) tells you how efficiently your ads convert spend into revenue. Customer Acquisition Cost (CAC) tells you how expensive each new customer is. Customer Lifetime Value (CLV) tells you how valuable those customers become over time. Optimizing all three in concert—not just ROAS alone—is what separates sustainable growth from short-term gains.
How ROAS Aligns with Your Digital Marketing Objectives
Different Digital Marketing Objectives require different ROAS strategies. A brand awareness campaign should not be held to the same ROAS standard as a direct response campaign targeting bottom-of-funnel buyers.
Common Digital Marketing Objectives and their ROAS implications include:
- Brand Awareness: Lower ROAS expectations are acceptable because the primary goal is reach, not immediate conversion. Measure brand lift alongside ROAS.
- Lead Generation: Moderate ROAS targets apply here. Focus on cost-per-lead and downstream conversion rates.
- Direct Sales / E-commerce: Highest ROAS expectations. Campaigns should demonstrate clear, measurable revenue impact.
- Customer Retention: ROAS should be evaluated alongside CLV—retention campaigns targeting existing customers often yield higher ROAS because conversion friction is lower.
Setting realistic ROAS benchmarks across industries
Industry benchmarks for Return on Ad Spend (ROAS) vary widely. E-commerce businesses typically target a minimum ROAS of 4:1, while industries with longer sales cycles—like B2B SaaS or financial services—may operate profitably at 2:1 or even lower, given high CLV. Retail often benchmarks at 3:1 to 5:1. Travel and hospitality can swing dramatically based on seasonality.
Rather than chasing a universal “good ROAS,” set benchmarks based on your specific margin structure, business model, and Digital Marketing Objectives.
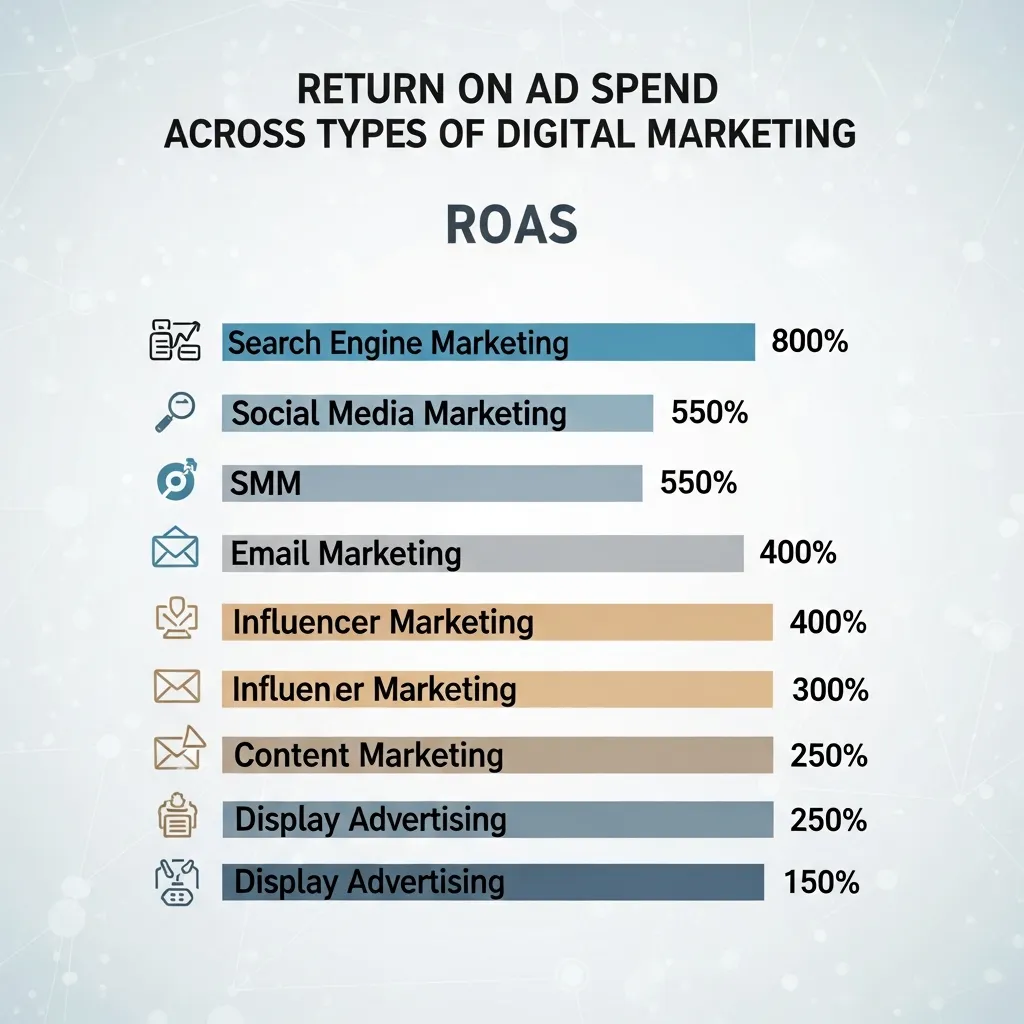
Return on Ad Spend Across Types of Digital Marketing
ROAS in social media advertising
Social media platforms like Meta, TikTok, LinkedIn, and Pinterest offer granular targeting and strong attribution tools. Return on Ad Spend (ROAS) on social media is highly dependent on creative quality, audience segmentation, and funnel stage. Top-of-funnel awareness campaigns on social typically deliver lower ROAS than retargeting campaigns—but the former fuels the latter.
ROAS in search engine marketing (SEM)
Paid search, particularly Google Ads, often delivers the highest Return on Ad Spend (ROAS) because it targets users with clear purchase intent. Bidding on high-intent keywords can yield ROAS of 5:1 or higher in competitive e-commerce categories. However, cost-per-click inflation in saturated categories can erode returns quickly if keyword strategies aren’t regularly optimized.
ROAS in email and content marketing
Email marketing consistently ranks as one of the highest-ROAS digital media channels, with industry estimates frequently citing returns of $36–$42 for every $1 spent (according to Litmus and HubSpot data). Content marketing delivers ROAS more slowly—often requiring six to twelve months of compounding—but produces sustainable, lower-cost traffic over time.
ROAS across other digital media channels
Programmatic display, connected TV (CTV), YouTube pre-roll, and podcast advertising each carry distinct ROAS profiles. Programmatic display typically has lower direct ROAS but plays a meaningful role in multi-touch attribution. CTV is emerging as a high-reach, brand-building channel with improving measurement capabilities. Assessing Return on Ad Spend (ROAS) across these digital media channels requires robust attribution models, which leads us to the next section.
How to Calculate and Measure Return on Ad Spend (ROAS)
Step-by-step ROAS calculation
- Define the campaign window: Set a clear date range.
- Total your ad spend: Include all paid media costs—creative production, platform fees, and agency costs if applicable.
- Measure revenue attributed to ads: Use UTM parameters, pixel tracking, and platform reporting to capture conversions.
- Apply the formula: ROAS = Revenue ÷ Ad Spend.
- Segment by channel, campaign, and audience: Aggregate ROAS masks performance differences. Break it down to find the real drivers.
Tools for tracking Return on Ad Spend (ROAS)
- Google Analytics 4 (GA4): Multi-channel attribution and conversion tracking.
- Google Ads & Meta Ads Manager: Native ROAS reporting at campaign and ad set level.
- Triple Whale, Northbeam, or Rockerbox: Third-party multi-touch attribution platforms built for e-commerce.
- HubSpot or Salesforce: CRM-integrated ROAS tracking for B2B and longer sales cycles.
Attribution models that affect ROAS measurement
The attribution model you choose directly impacts reported Return on Ad Spend (ROAS). Last-click attribution overvalues bottom-of-funnel channels like branded search. First-click attribution overvalues awareness channels. Data-driven attribution—available in GA4 and Google Ads—uses machine learning to distribute credit proportionally, making it the most accurate option for complex customer journeys across multiple digital media touchpoints.
Strategies to Improve Return on Ad Spend (ROAS)
Audience targeting and segmentation
Narrowing your audience improves relevance, which drives higher conversion rates and better Return on Ad Spend (ROAS). Use first-party data to build custom audiences from existing customers, website visitors, and email subscribers. Layer in lookalike modeling to expand reach without sacrificing relevance.
A/B testing and creative optimization
Underperforming creatives are one of the most common ROAS killers. Run structured A/B tests on headlines, visuals, calls-to-action, and landing pages. Even small improvements in click-through and conversion rates can significantly lift Return on Ad Spend (ROAS) at scale.
Budget allocation strategies
Shift budget toward campaigns and channels delivering above-benchmark ROAS—but don’t cut top-of-funnel entirely. Use a portfolio approach: allocate the majority of budget to high-ROAS conversion campaigns, while maintaining investment in brand awareness to sustain future pipeline. Dayparting, geographic targeting, and device-level bid adjustments can also extract meaningful ROAS efficiency from existing spend.
Common ROAS Mistakes to Avoid
Ignoring Customer Lifetime Value (CLV): A ROAS-only lens can lead you to cut campaigns that are actually delivering highly valuable customers. Always evaluate Return on Ad Spend (ROAS) in context of CLV.
Treating all digital media channels equally: Each channel in your digital media mix has a different role and expected ROAS range. Comparing display advertising ROAS directly to branded search ROAS without context is misleading.
Using last-click attribution exclusively: Last-click attribution concentrates ROAS credit on the final touchpoint and undervalues the channels that built awareness and intent throughout the funnel.
Neglecting tracking infrastructure: Broken pixels, missing UTM parameters, and iOS privacy changes can cause significant gaps in ROAS data. Audit your tracking setup regularly.
Chasing short-term ROAS at the expense of growth: Optimizing purely for high ROAS often means targeting only your warmest audiences—the people most likely to convert anyway. This limits new customer acquisition and makes your Customer Acquisition Cost (CAC) worse over time.
The Smarter Way to Use ROAS in Your Marketing Strategy
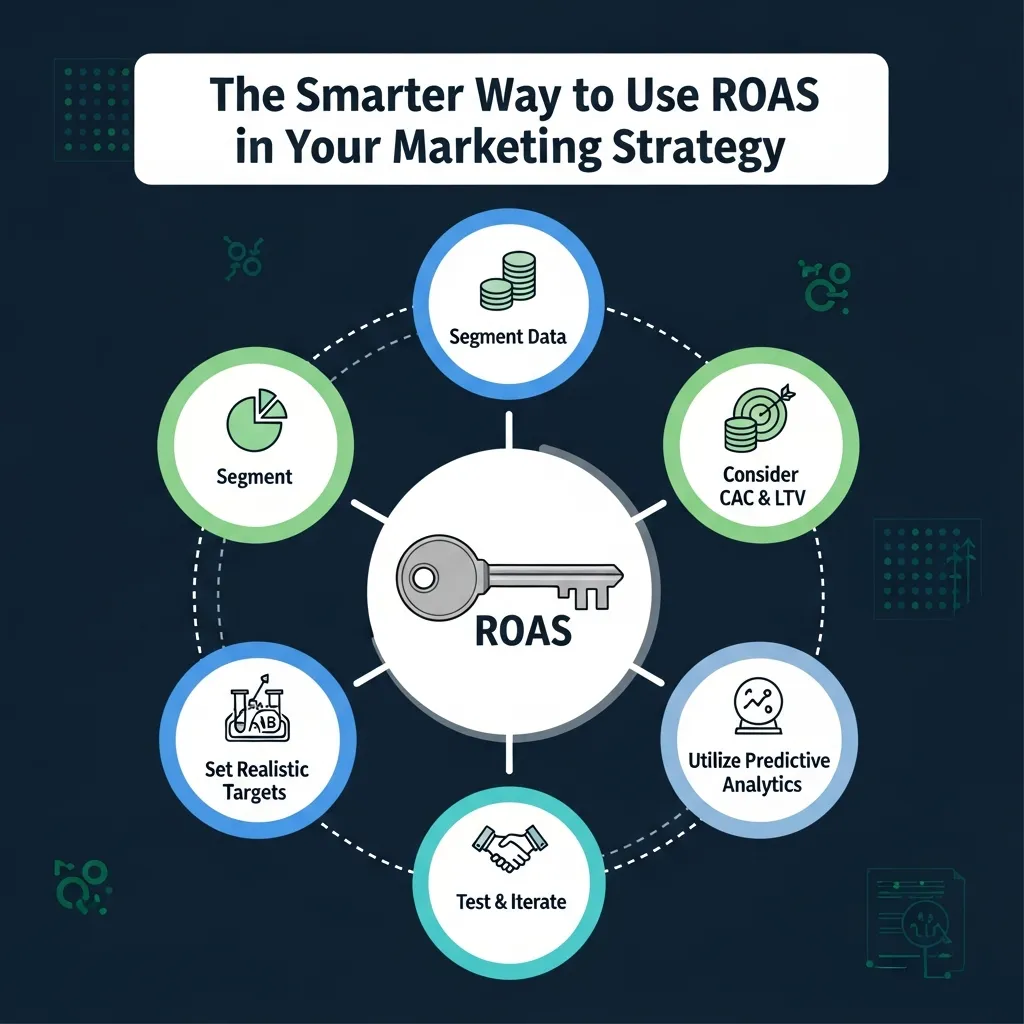
Return on Ad Spend (ROAS) is one of the most powerful metrics in digital marketing—but only when used thoughtfully. A 10:1 ROAS on a hyper-targeted retargeting campaign looks impressive, but it won’t scale indefinitely. A 2.5:1 ROAS on a prospecting campaign feeding customers with high Customer Lifetime Value (CLV) may ultimately drive more profit.
The marketers who get the most from Return on Ad Spend (ROAS) are those who treat it as one instrument in a larger orchestra—calibrated alongside Customer Acquisition Cost (CAC), Customer Lifetime Value (CLV), and clearly defined Digital Marketing Objectives.
Start by auditing your current attribution setup. Then set channel-specific ROAS benchmarks grounded in your margin structure. Build a testing cadence for creative and audience refinement. And review performance monthly—not just when campaigns start to slip.
Apply these principles consistently, and Return on Ad Spend (ROAS) becomes more than a reporting metric. It becomes a strategic compass for every dollar you invest in digital media.
Frequently Asked Questions About Return on Ad Spend (ROAS)
1. What is a good Return on Ad Spend (ROAS) benchmark?
A common starting benchmark is 4:1—meaning $4 in revenue for every $1 spent. However, a “good” ROAS varies by industry, margin, and Digital Marketing Objectives. High-margin businesses can profit at 2:1, while low-margin e-commerce may need 6:1 or higher to remain profitable.
2. How do I calculate Return on Ad Spend (ROAS) for multiple campaigns?
Calculate ROAS individually for each campaign using the formula Revenue ÷ Ad Spend, then aggregate for a blended view. Avoid relying solely on blended ROAS—campaign-level breakdowns reveal which channels and creatives are driving performance.
3. What’s the difference between ROAS and ROI?
Return on Ad Spend (ROAS) measures revenue relative to ad spend only. ROI (Return on Investment) factors in all costs—production, staffing, overhead—and measures net profit. ROAS is a faster, tactical metric; ROI provides a broader profitability view.
4. How does Customer Acquisition Cost (CAC) affect Return on Ad Spend?
High Customer Acquisition Cost (CAC) can erode the profitability of even a strong ROAS. If you’re spending $150 to acquire a customer who generates $200 in a single purchase, your ROAS may look healthy while your margins suffer. Always evaluate ROAS alongside CAC and CLV.
5. Can Return on Ad Spend (ROAS) be improved without increasing budget?
Yes. Improving audience targeting, creative quality, landing page conversion rates, and bidding strategies can all lift ROAS without additional spend. Attribution model improvements can also reveal where existing budget is undervalued.
6. How do I track Return on Ad Spend across different digital media channels?
Use a combination of platform-native reporting (Google Ads, Meta Ads Manager), UTM parameter tracking in GA4, and a third-party attribution tool like Triple Whale or Northbeam to get a unified view of ROAS across all digital media channels.
7. What role does Customer Lifetime Value (CLV) play in ROAS strategy?
Customer Lifetime Value (CLV) provides the long-term context that ROAS alone cannot. A campaign with modest Return on Ad Spend (ROAS) may be highly profitable if it acquires customers with high CLV. Set ROAS targets relative to CLV to avoid underinvesting in valuable acquisition campaigns.
8. How often should I review and adjust Return on Ad Spend (ROAS) targets?
Review ROAS monthly at a minimum for ongoing campaigns, and at the close of every major campaign sprint. Revisit ROAS benchmarks quarterly to account for seasonality, competitive shifts, and changes in your cost structure.
9. What’s the impact of seasonality on Return on Ad Spend (ROAS)?
Seasonality can cause significant ROAS fluctuations. Q4 retail campaigns often spike due to high purchase intent, while ROAS in slow seasons may dip. Build seasonal benchmarks from historical data and adjust budgets and targets accordingly rather than reacting to short-term swings.
10. How do I optimize Return on Ad Spend for different Digital Marketing Objectives?
Align ROAS targets with each campaign’s role in the funnel. Set lower ROAS expectations for brand awareness campaigns aligned to top-of-funnel Digital Marketing Objectives, and higher targets for conversion-focused campaigns. Treating every campaign to the same ROAS standard distorts performance analysis.
11. What attribution model is best for measuring Return on Ad Spend (ROAS)?
Data-driven attribution is generally the most accurate for measuring Return on Ad Spend (ROAS) across complex, multi-touchpoint customer journeys. It distributes conversion credit based on actual behavioral data rather than arbitrary rules. It’s available natively in Google Ads and GA4.
12. How can AI improve Return on Ad Spend (ROAS) analysis and optimization?
AI-powered tools can analyze large datasets to identify ROAS patterns, automate bid adjustments, personalize creative delivery, and predict which audience segments are most likely to convert at target ROAS thresholds. Platforms like Google’s Performance Max and Meta’s Advantage+ use machine learning to optimize Return on Ad Spend (ROAS) in real time, while analytics tools increasingly offer AI-driven attribution modeling.



Leave a Reply