Data is everywhere, but insight is rare. Digital marketers today collect mountains of information—website traffic, click-through rates, conversion metrics, social media engagement. Yet the real challenge isn’t gathering data; it’s transforming those numbers into compelling narratives that stakeholders understand and act upon. This comprehensive guide explores how digital marketers convey insights effectively, bridging the gap between raw analytics and strategic decision-making. From visualization techniques to storytelling frameworks, you’ll discover practical methods for turning data into your most persuasive communication tool.
The marketing landscape has fundamentally changed. A decade ago, campaigns were evaluated by brand awareness and creative impact. Today, every marketing decision can be tracked, measured, and quantified. But this abundance of data has created a new problem: information overload.
Marketing teams now generate reports filled with metrics, dashboards, and analytics. Executives receive presentations packed with charts and graphs. Yet despite all this data, many organizations struggle to extract meaningful insights that actually inform strategy.
The difference between successful marketing teams and those that flounder isn’t access to data—it’s the ability to communicate what that data means. Digital marketers who master the art of conveying insights don’t just report numbers; they tell stories that connect metrics to business outcomes, reveal hidden opportunities, and inspire confident decision-making.
Navigating a Digital Marketing Career Switch in a Data-Driven World
Professionals considering a digital marketing career switch often worry about their technical skills. Can someone from traditional advertising or brand management thrive when metrics and analytics dominate every conversation?
The answer is yes—but success requires developing new competencies in how digital marketers convey insights. Here’s what matters most:
Building Analytical Literacy
You don’t need to become a data scientist, but you do need to understand what different metrics mean and which ones actually matter for your objectives. Spend time learning platforms like Google Analytics, social media insights tools, and email marketing dashboards. Focus not on memorizing every feature, but on understanding how to extract meaningful patterns.
Developing Storytelling Skills
Ironically, professionals from creative or communications backgrounds often have an advantage here. The ability to craft a narrative from data points is fundamentally a storytelling skill. Your background in creating compelling messages translates directly—you’re just working with different raw materials.
Practicing Translation
The most valuable skill is translating between technical and non-technical audiences. Can you take a complex attribution model and explain what it means for budget allocation in plain English? Can you help your development team understand why certain user experience metrics matter to business goals? This translation ability makes you indispensable.
Embracing Continuous Learning
Digital marketing evolves rapidly. New platforms emerge, algorithms change, and measurement capabilities expand. Professionals who successfully make the digital marketing career switch embrace this constant evolution rather than resisting it. They stay curious and maintain a learning mindset.
Traditional Advertising vs. Digital Performance Tracking
The contrast between traditional advertising and digital marketing approaches reveals why insight communication has become so critical.
Traditional advertising operated largely on faith and delayed feedback. You’d launch a billboard campaign or TV commercial, then wait weeks or months for brand awareness surveys or sales data to indicate whether it worked. Creative intuition and brand expertise guided decisions more than hard data.
Digital marketing flips this model entirely. You can see within hours whether your social media campaign is resonating. You know within days if your email sequence is converting. Real-time dashboards show exactly which channels are driving revenue and which are wasting budget.
This immediacy is powerful, but it also creates pressure. Stakeholders expect regular updates and data-backed justifications for every decision. Marketing teams must constantly demonstrate ROI and optimize based on performance metrics.
The challenge is avoiding two extremes: getting lost in vanity metrics that look impressive but don’t connect to business outcomes, or becoming so data-obsessed that creativity and brand-building suffer.
The most effective digital marketers find balance. They use data to inform decisions and measure results, but they also maintain the creative thinking and strategic perspective that traditional advertising cultivated. When they convey insights, they connect the quantitative with the qualitative—showing both what the numbers say and what they mean for the brand’s broader narrative.
Case Study: Streaming Market Share Breakdown
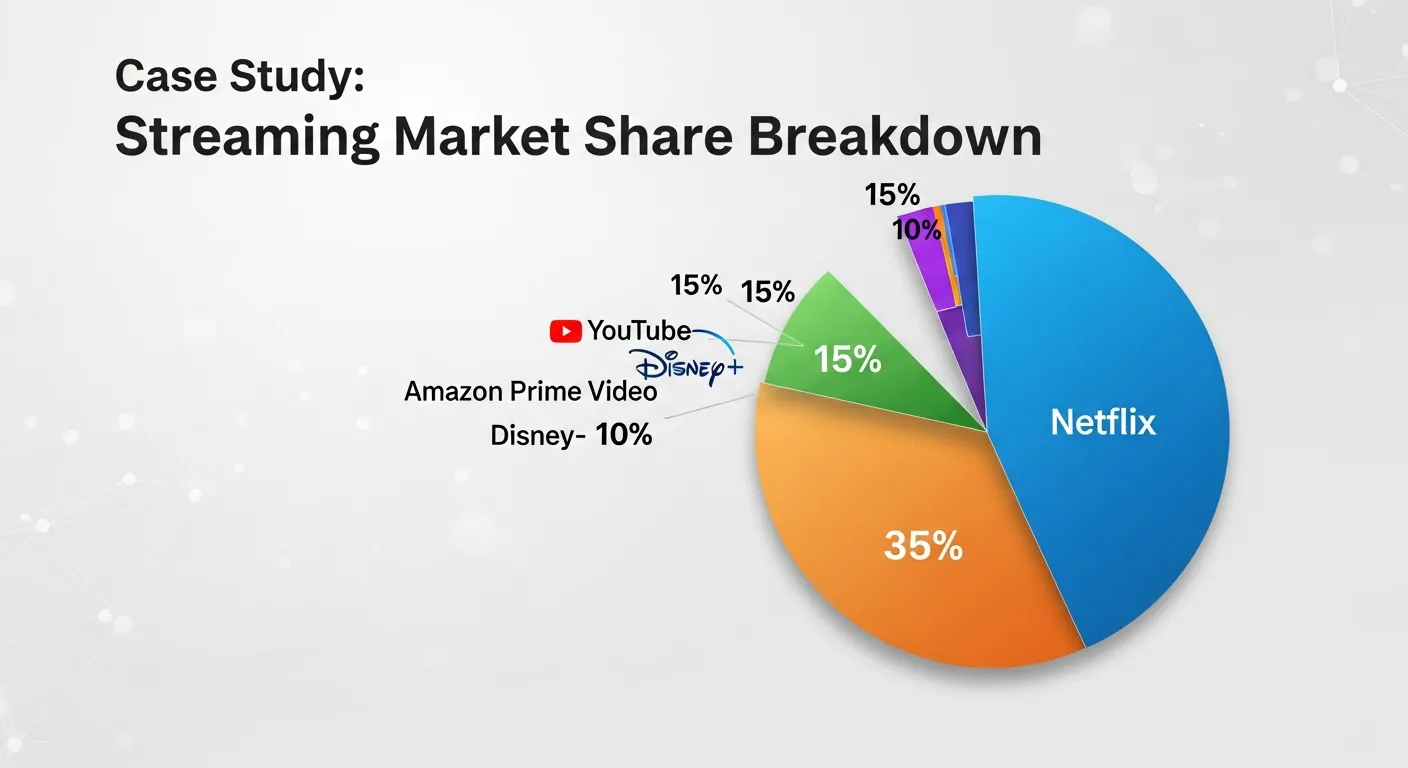
Consider how a streaming market share breakdown illustrates effective insight communication. Raw data might show that Netflix holds 35% market share, Disney+ has 22%, HBO Max has 15%, and various other services split the remainder.
But presenting just those percentages misses the opportunity to convey meaningful insights. A skilled digital marketer would dig deeper:
Trend Analysis: While Netflix maintains the largest share, it’s declined from 45% two years ago. Disney+ has grown from 8% in the same period. This shift reveals changing consumer preferences and competitive dynamics.
Demographic Breakdown: When segmented by age, the picture changes dramatically. Gen Z viewers show nearly equal distribution across platforms, while Boomers concentrate heavily on Netflix and traditional cable streaming services.
Content Performance: Analyzing which genres and content types drive subscriptions reveals that limited series and event programming create spikes, while catalog depth maintains steady subscribers.
Churn Patterns: The data shows viewers increasingly subscribe for specific shows, then cancel—a pattern that impacts customer lifetime value calculations and content strategy.
By presenting the streaming market share breakdown this way, digital marketers convey insights that inform strategic decisions: Should we invest in event programming or build a deeper catalog? Which demographics should we target? How do we reduce churn?
This approach transforms data from a static snapshot into a strategic compass. The numbers become a foundation for discussion and decision-making rather than an endpoint.
Building a Thriving Community on Social Media Through Transparent Reporting
One often-overlooked application of effective insight communication is external: sharing data and insights with your audience to build trust and engagement.
Brands that create a thriving community on social media increasingly use transparent reporting as a relationship-building tool. Buffer pioneered this approach by publicly sharing their revenue, pricing decisions, and even employee salaries. This radical transparency generated enormous goodwill and positioned them as thought leaders.
You don’t need to go that far to benefit from the principle. Consider these approaches:
Behind-the-Scenes Metrics: Share interesting data about your content performance, like “Our most engaged post this month wasn’t what we expected—here’s what we learned.” This invites your audience into your learning process.
Industry Insights: Use your data access to provide value. A B2B SaaS company might share anonymized benchmarks showing how their industry’s email open rates compare across segments, positioning themselves as knowledgeable partners.
Progress Updates: Show your community how you’re growing and evolving. “We’ve helped 10,000 customers this year” becomes more compelling when you share the journey—the challenges overcome and lessons learned.
Collaborative Analysis: Ask your community to help interpret interesting patterns in your data. This engagement transforms passive followers into active participants in your brand story.
When digital marketers convey insights externally this way, they accomplish multiple goals simultaneously: providing value, building authority, fostering community connection, and generating content that naturally encourages sharing and discussion.
Practical Tips for Reporting Success
Effective insight communication requires both strategic thinking and tactical execution. Here are battle-tested approaches for making your reporting more impactful:
Use Accessible Language for Non-Technical Stakeholders
Avoid jargon when possible. Instead of “Our CTR improved 23% while CPC decreased 15%, improving overall ROAS by 31%,” try “We’re getting more people to click on our ads while spending less per click, which means each dollar invested is returning 31% more revenue than before.”
The second version takes slightly longer but ensures everyone in the room understands the achievement and its business impact.
Prioritize Actionable Metrics Over Vanity Numbers
Page views might look impressive, but if they don’t lead to conversions, what do they actually mean? Focus on metrics that connect to business outcomes:
- Instead of “50,000 website visitors,” report “50,000 visitors with a 3.2% conversion rate, generating 1,600 qualified leads”
- Rather than “100,000 social media impressions,” share “100,000 impressions resulting in 2,500 engaged users who spent an average of 4 minutes with our content”
- Replace “30% email open rate” with “30% open rate and 8% click-through rate, driving $45,000 in attributed revenue”
This shift from vanity metrics to actionable insights changes how stakeholders perceive your work and understand its value.
Incorporate Narrative Structures Into Monthly Reviews
Don’t just present data—tell the story of what happened during the reporting period:
Set the scene: Remind stakeholders of the goals and context at the period’s start.
Introduce the challenge: What obstacles or opportunities emerged?
Show the action: What strategies did you implement in response?
Reveal the results: How did your efforts impact the metrics that matter?
Point toward the future: What insights from this period inform next steps?
This narrative structure helps stakeholders remember and act on your insights far better than a simple list of metrics and their changes.
Create Executive Summaries That Stand Alone
Busy executives often only read the first page of reports. Make sure your executive summary:
- Highlights the three most important insights
- Clearly states whether you’re on track to meet goals
- Identifies any decisions that need to be made
- Uses bullet points for scanability
The rest of your report can provide detail for those who want it, but never bury your key insights in the middle of a lengthy document.
Compare to Meaningful Benchmarks
Context matters enormously. A 2% conversion rate might be disappointing for one industry but excellent for another. Always provide comparison points:
- Previous time periods (month-over-month, year-over-year)
- Industry benchmarks when available
- Internal goals and targets
- Performance across different segments or campaigns
These comparisons help stakeholders understand whether results represent success, failure, or something requiring further investigation.
The Evolution of Insight Communication
As marketing technology continues advancing, the ways digital marketers convey insights will keep evolving. Several trends are reshaping this landscape:
Artificial intelligence and machine learning are beginning to automate routine reporting, freeing marketers to focus on interpretation and strategy. Rather than spending hours building dashboards, marketers can dedicate that time to understanding what the patterns mean and what actions to recommend.
Predictive analytics shift the conversation from “what happened” to “what’s likely to happen next.” This forward-looking perspective makes insights more valuable for strategic planning, though it also requires marketers to communicate uncertainty and probability effectively.
Real-time reporting enables more agile decision-making but also creates pressure for constant monitoring and faster response times. The challenge becomes distinguishing meaningful signals from normal variance—knowing when to react and when to wait for more data.
Cross-channel attribution grows more sophisticated, finally helping marketers demonstrate how different touchpoints work together in the customer journey. This complexity requires even clearer communication to help stakeholders understand multi-touch attribution models and why they matter.
Despite these technological advances, the fundamental skill remains unchanged: the ability to extract meaning from data and communicate it in ways that inform decisions and drive action. Technology enhances this capability but doesn’t replace the human judgment required to determine what insights matter most and how to present them compellingly.
Making Data Your Strategic Advantage
The organizations that win in marketing’s data-driven era won’t necessarily be those with the most sophisticated analytics platforms or the largest data sets. They’ll be the ones whose marketers can effectively bridge the gap between data and decision-making.
When digital marketers convey insights with clarity, context, and strategic perspective, data transforms from an overwhelming burden into a competitive advantage. Numbers become narratives. Metrics become meaning. Reports become roadmaps.
This skill—turning information into understanding—will only grow more valuable as data becomes more abundant and decisions require faster, more confident action. Whether you’re navigating a digital marketing career switch, building a thriving community on social media, or simply trying to demonstrate your marketing team’s value, your ability to communicate insights effectively will define your impact.
Start by examining your current reporting practices. Are you truly conveying insights, or just presenting data? Are your stakeholders able to quickly grasp what the numbers mean and what they should do differently? Do your reports inspire confidence and action, or confusion and delay?
The answers to these questions reveal opportunities for improvement—opportunities that will make you more valuable to your organization and more effective in your role.
Frequently Asked Questions – Digital Marketers Convey Insights
What’s the difference between data and insights?
Data are raw numbers; insights interpret that data to inform decisions. Digital marketers convey insights by turning metrics into actionable strategies.
How often should reports be shared?
Weekly for operational updates, monthly for strategy, and quarterly to align with overall business goals—consistency is key for digital marketers to convey insights.
Which tools help digital marketers convey insights?
Google Analytics, Data Studio, Tableau, Power BI, and platform-specific dashboards. Tools aid visualization, but insights come from interpretation.
How to make reports engaging for non-technical audiences?
Use plain language, visuals, storytelling, and highlight business impact—help stakeholders quickly grasp the insights.
Which metrics show marketing ROI?
Focus on revenue-linked metrics: CAC, CLV, conversions, qualified leads. Digital marketers convey insights that connect metrics to real business value.
How to report underperforming campaigns?
Be transparent, explain findings, and outline improvements. Digital marketers convey insights even when results are low.
Comparing traditional vs. digital marketing?
Use comparable metrics like cost per acquisition or reach. Show how digital precision complements traditional brand awareness.
Using insights to build social media communities?
Share interesting patterns, benchmarks, and lessons learned. Digital marketers convey insights to engage and educate their audience.
Switching to digital marketing from traditional marketing?
Learn analytics, focus on interpretation and storytelling. Digital marketers convey insights to link strategy with data.
Reporting for different audience levels?
Executives need concise summaries, managers need trends and context, teams need detailed metrics—layer your insights accordingly.
Role of visualization in conveying insights?
Charts and graphs make patterns obvious. Digital marketers convey insights effectively when visuals are paired with interpretation.
Staying current with insight communication?
Follow thought leaders, blogs, webinars, and experiment with new tools. Continuous learning helps digital marketers convey insights efficiently.


Leave a Reply