Digital Marketing Reporting is the process of collecting, analyzing, and presenting data from your online marketing channels to measure performance and guide decisions. Done well, it turns raw numbers into clear insights—helping you optimize campaigns, prove ROI, and spot new opportunities before your competitors do.
Marketing budgets are under more scrutiny than ever. Executives want proof that every dollar spent online actually drives results. That’s where Digital Marketing Reporting comes in. It’s the bridge between the activity you run and the outcomes your business cares about.
This guide breaks down everything you need to know about Digital Marketing Reporting. You’ll learn what it is, which metrics matter most, how to structure a report that people actually read, and how to report on each major channel—from SEO to email. We’ll also cover advanced techniques, common pitfalls, and practical best practices you can apply right away.
Whether you manage a small business or lead a marketing team at a large enterprise, strong reporting habits will sharpen your strategy and strengthen your case for budget. Let’s get into it.
What is Digital Marketing Reporting?
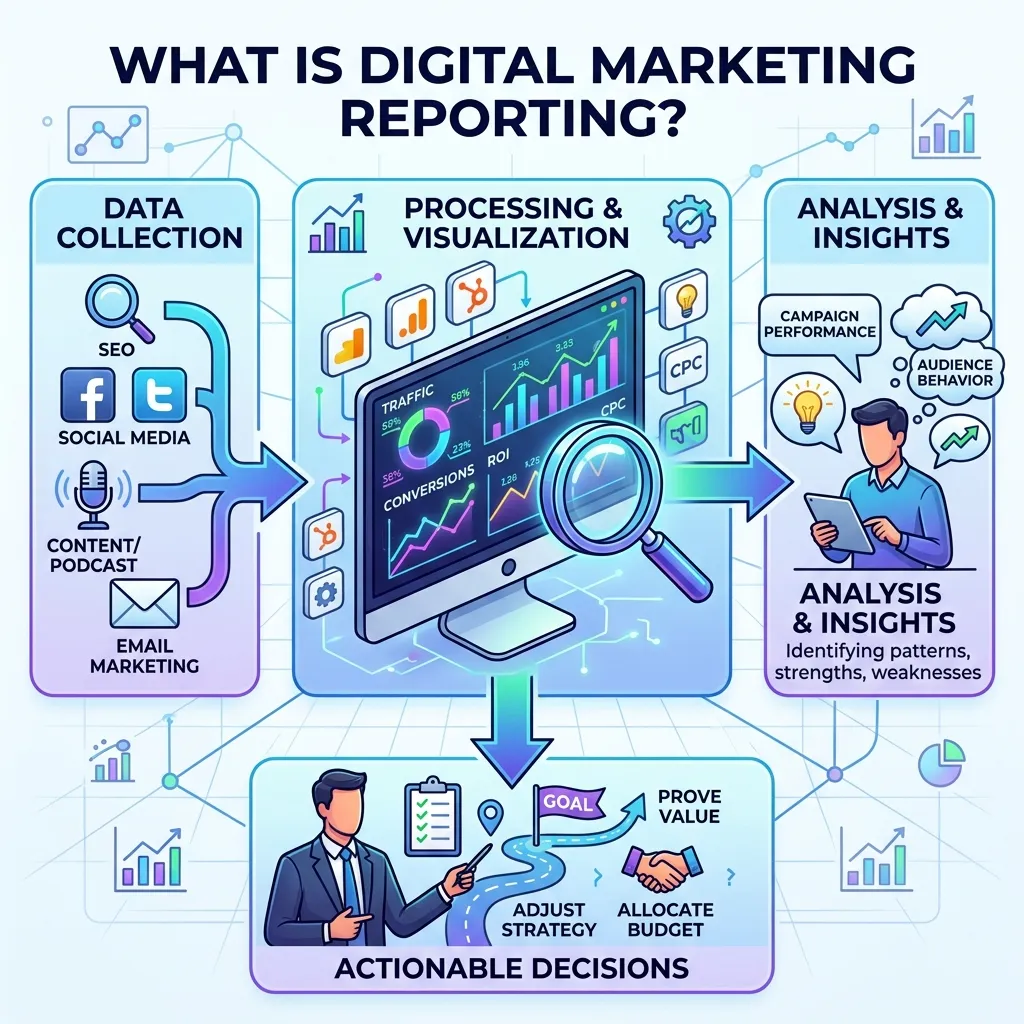
Digital Marketing Reporting is the practice of gathering data from your digital channels, analyzing it, and presenting it in a clear, structured format. The goal is simple: understand what’s working, what isn’t, and what to do next.
A good report pulls together numbers from many sources—your website, ad platforms, social profiles, email tools, and more. It then translates those numbers into a story that stakeholders can understand and act on.
Why is Digital Marketing Reporting essential?
Without reporting, marketing becomes guesswork. You might feel like a campaign is performing well, but feelings don’t justify a budget. Digital Marketing Reporting gives you the evidence you need to make smart calls.
Strong reporting helps you spot underperforming campaigns early, double down on what’s working, and show leadership exactly how marketing contributes to revenue. It also builds trust. When stakeholders see consistent, honest reporting, they’re far more likely to support your plans.
The evolution of digital marketing: when “digital marketing” was first coined
The phrase “Digital Marketing Was First Coined” in the 1990s, as the internet moved from a niche tool to a mainstream platform. Early marketers experimented with banner ads and basic websites, with very little data to guide them.
Reporting in those days was crude. Marketers counted page views and clicks, but had few ways to connect those numbers to actual sales. Today, the picture is completely different. Modern tools track the full customer journey, from the first ad impression to the final purchase. This shift has made Digital Marketing Reporting one of the most valuable skills a marketer can have.
Core components of effective Digital Marketing Reporting
Great reports share a few common building blocks: the right metrics, reliable data tools, and a clear structure. Let’s look at each.
What are the key performance indicators (KPIs) in digital marketing?
KPIs are the specific numbers that show whether you’re hitting your goals. Choosing the right ones keeps your reports focused and useful. Here are the core categories of Digital Marketing Performance Metrics.
Website traffic metrics. These track how many people visit your site and where they come from. Key figures include total sessions, unique visitors, traffic sources, and bounce rate. They tell you how well you attract attention.
Conversion rates. A conversion is any action you want a visitor to take—buying a product, filling out a form, or signing up for a newsletter. Conversion rate is the percentage of visitors who complete that action. It’s one of the clearest signs of how well your marketing turns interest into results.
Engagement metrics. These show how people interact with your content. Think time on page, pages per session, social shares, comments, and likes. High engagement usually means your content resonates with your audience.
Lead generation metrics. For many businesses, the goal is capturing leads. Track the number of leads, cost per lead, and lead quality. These numbers connect your marketing directly to your sales pipeline.
Return on investment (ROI). ROI compares what you spend to what you earn. It’s the metric executives care about most. A positive ROI proves that your marketing pays for itself and then some.
Which data collection and analysis tools should you use?
You can’t report on data you don’t collect. These tools form the backbone of most Digital Marketing Reporting setups.
- Google Analytics. The standard for website data. It tracks traffic, behavior, conversions, and much more—all for free.
- Social media analytics. Platforms like Meta, LinkedIn, and X offer built-in dashboards that show reach, engagement, and audience growth.
- Email marketing platforms. Tools such as Mailchimp and Klaviyo report on open rates, clicks, and conversions for every Email Marketing campaign you send.
- CRM systems. A customer relationship management tool like HubSpot or Salesforce ties marketing activity to actual sales, closing the loop on ROI.
How should you structure a digital marketing report?
A clear structure makes your report easy to follow. Most effective reports include four parts.
- Executive summary. A short overview of the key results and takeaways. Write this for busy leaders who want the headline first.
- Performance overview by channel. A breakdown of how each channel—SEO, PPC, social, email—performed during the reporting period.
- Key findings and insights. The “so what” section. Explain what the numbers mean and why they matter.
- Recommendations and next steps. Clear, action-focused suggestions based on the data.
A deep dive into digital marketing channels and their reporting
Each channel has its own metrics and quirks. Here’s how to report on the five most common ones.
How do you report on SEO performance?
Search engine optimization reporting focuses on your visibility in organic search results. Track these three areas:
- Organic traffic and rankings. Measure how many visitors arrive through search and where your pages rank for target keywords.
- Keyword performance. Monitor which keywords drive traffic and conversions, and watch for new ranking opportunities.
- Backlink analysis. Track the number and quality of sites linking to you, since backlinks remain a major ranking factor.
How do you report on PPC advertising?
Pay-per-click reporting measures the efficiency of your paid campaigns. The key metrics include:
- Click-through rate (CTR) and cost per click (CPC). CTR shows how often people click your ads. CPC shows what each click costs. Together, they reveal how compelling and affordable your ads are.
- Conversion tracking and cost per acquisition (CPA). CPA tells you how much you pay to win a customer. Lower is usually better—as long as quality holds steady.
- Ad spend vs. revenue. The bottom line for any paid campaign. Strong Advertising Copywriting often improves these numbers, since better ad copy lifts clicks and conversions without raising spend.
How do you report on social media marketing?
Social media reporting tracks how your brand grows and engages online. Focus on:
- Reach and impressions. Reach counts the unique people who saw your content. Impressions count total views, including repeats.
- Engagement rates. The percentage of viewers who like, comment, share, or click. This shows how well your content connects.
- Audience growth. The pace at which your follower base expands over time.
How do you report on content marketing?
Content marketing reporting connects your blog posts, videos, and guides to business results. Watch these metrics:
- Content performance metrics. Page views, time on page, and shares tell you which pieces resonate.
- Lead attribution. Track how many leads each piece of content generates.
- SEO impact. Measure how your content improves rankings and organic traffic over time.
How do you report on email marketing?
Email Marketing remains one of the highest-ROI channels available. Track these figures for every campaign:
- Open rates and click-through rates. Open rate shows how many people opened your email. Click-through rate shows how many clicked a link inside.
- Conversion and unsubscribe rates. Conversions reveal whether your emails drive action. Unsubscribe rates flag when content misses the mark.
- Segment performance. Compare how different audience segments respond, then tailor future sends accordingly.
Why does Digital Marketing Reporting matter strategically?
Reporting isn’t just about looking back. It shapes the future of your marketing. Here’s how strong Digital Marketing Reporting drives strategy.
Informing decision-making. Data removes the guesswork. When you know which campaigns deliver, you can invest with confidence.
Optimizing campaigns. Reports highlight what to fix and what to scale. Small, data-driven tweaks add up to big gains over time.
Demonstrating ROI to stakeholders. Clear reporting proves marketing’s value. It turns “we think this worked” into “here’s exactly what we earned.”
Identifying trends and opportunities. Patterns in your data can reveal new audiences, rising channels, or seasonal shifts you can capitalize on.
What are the advanced techniques in Digital Marketing Reporting?
Once you’ve mastered the basics, these techniques take your reporting further.
Predictive analytics in digital marketing
Predictive analytics uses past data to forecast future outcomes. It can estimate which leads are most likely to convert or predict next quarter’s traffic. This helps you plan proactively instead of reacting after the fact.
A/B testing and experimentation
A/B testing compares two versions of a webpage, ad, or email to see which performs better. Reporting on these tests gives you hard evidence for what your audience prefers, removing opinion from the equation.
Integrated reporting dashboards
An integrated dashboard pulls data from all your channels into one view. Tools like Looker Studio or Tableau update in real time, so you spend less time building reports and more time acting on them.
What are the biggest challenges and best practices in Digital Marketing Reporting?
Even experienced marketers hit roadblocks. Here are the most common challenges and how to handle them.
Data silos and integration issues. When data lives in separate tools that don’t talk to each other, reporting gets messy. Use integrated dashboards or a CRM to bring everything together.
Choosing the right metrics. It’s easy to drown in numbers. Focus on the few KPIs that tie directly to business goals, and skip the vanity metrics.
Presenting data effectively. A report full of raw tables overwhelms readers. Use charts, clear labels, and short summaries to make insights obvious.
Continuous improvement. Treat reporting as a living process. Review your metrics regularly, refine your approach, and adapt as your goals shift.
The future of Digital Marketing Reporting
Digital Marketing Reporting has come a long way from counting banner clicks. As tools grow smarter and AI takes on more of the heavy lifting, reporting will become faster, more predictive, and more deeply tied to revenue.
The marketers who thrive will be those who treat reporting as a strategic skill, not a chore. Start by choosing a handful of meaningful KPIs, pick tools that fit your needs, and build a simple, repeatable report you can share each month. Over time, layer in advanced techniques like predictive analytics and integrated dashboards.
The data is already there. Your job is to turn it into a story that drives smarter decisions—and that’s exactly what good Digital Marketing Reporting does.
Frequently asked questions
What is Digital Marketing Reporting?
Digital Marketing Reporting is the process of collecting data from your online marketing channels, analyzing it, and presenting it in a clear format. It shows how your campaigns perform and guides your next decisions.
Why is Digital Marketing Reporting important for businesses?
It replaces guesswork with evidence. Reporting helps businesses optimize campaigns, prove return on investment, and justify marketing budgets to leadership with real data.
When was “digital marketing” first coined?
The phrase “Digital Marketing Was First Coined” in the 1990s, as the internet became mainstream. Early efforts focused on banner ads and basic websites, with limited ways to measure results.
What are the essential Digital Marketing Performance Metrics?
The most essential Digital Marketing Performance Metrics include website traffic, conversion rates, engagement metrics, lead generation figures, and return on investment (ROI). Together, they show the full picture of campaign health.
How does Advertising Copywriting relate to reporting?
Advertising Copywriting directly affects metrics like click-through rate and conversion rate. Reporting shows which copy performs best, so you can refine your messaging and improve results over time.
What role does Email Marketing play in Digital Marketing Reporting?
Email Marketing is one of the highest-ROI channels, so it’s a key part of any report. Tracking open rates, click-through rates, and conversions reveals how well your emails engage and convert subscribers.
What tools are commonly used for Digital Marketing Reporting?
Common tools include Google Analytics for website data, native social media dashboards, email platforms like Mailchimp, CRM systems like HubSpot or Salesforce, and visualization tools like Looker Studio or Tableau.
How often should Digital Marketing Reports be generated?
Most teams report monthly, which balances detail with workload. However, fast-moving campaigns like PPC may need weekly or even daily checks, while strategic reviews often happen quarterly.
What is the difference between data and insights in reporting?
Data is the raw numbers, like 10,000 page views. Insights explain what those numbers mean and what to do about them. Good reporting always turns data into insights.
How can I improve my Digital Marketing Reporting?
Focus on a few meaningful KPIs, use clear visuals, automate data collection where possible, and always include recommendations. Tie every metric back to a business goal.
What are the benefits of automated Digital Marketing Reporting?
Automation saves time, reduces human error, and delivers real-time data. It frees marketers from manual data entry so they can focus on analysis and strategy instead.
How does Digital Marketing Reporting contribute to ROI?
By showing which campaigns earn the most for the least spend, Digital Marketing Reporting helps you shift budget toward high performers. This optimization directly improves your overall return on investment.


Leave a Reply