
Digital marketing analytics helps businesses use data to optimize campaigns, boost ROI, and improve customer engagement and retention.
Most businesses throw money at digital marketing campaigns without truly understanding what works. They create content, run ads, and hope for the best—often watching budgets disappear with little to show for it. This scatter-shot approach might have worked a decade ago, but modern consumers expect personalized, relevant experiences that only data-driven strategies can deliver.
Digital marketing analytics transforms guesswork into precision. By measuring the right metrics and interpreting data correctly, businesses can optimize campaigns in real-time, eliminate wasteful spending, and dramatically improve their return on investment. Whether you’re running social media campaigns, email marketing, or paid advertising, analytics provides the insights needed to make every dollar count.
This comprehensive guide explores how to harness the power of digital marketing analytics to drive measurable results. You’ll discover which metrics matter most, learn to avoid common measurement pitfalls, and gain practical strategies for turning raw data into actionable campaign improvements.
Understanding Digital Marketing Analytics Fundamentals
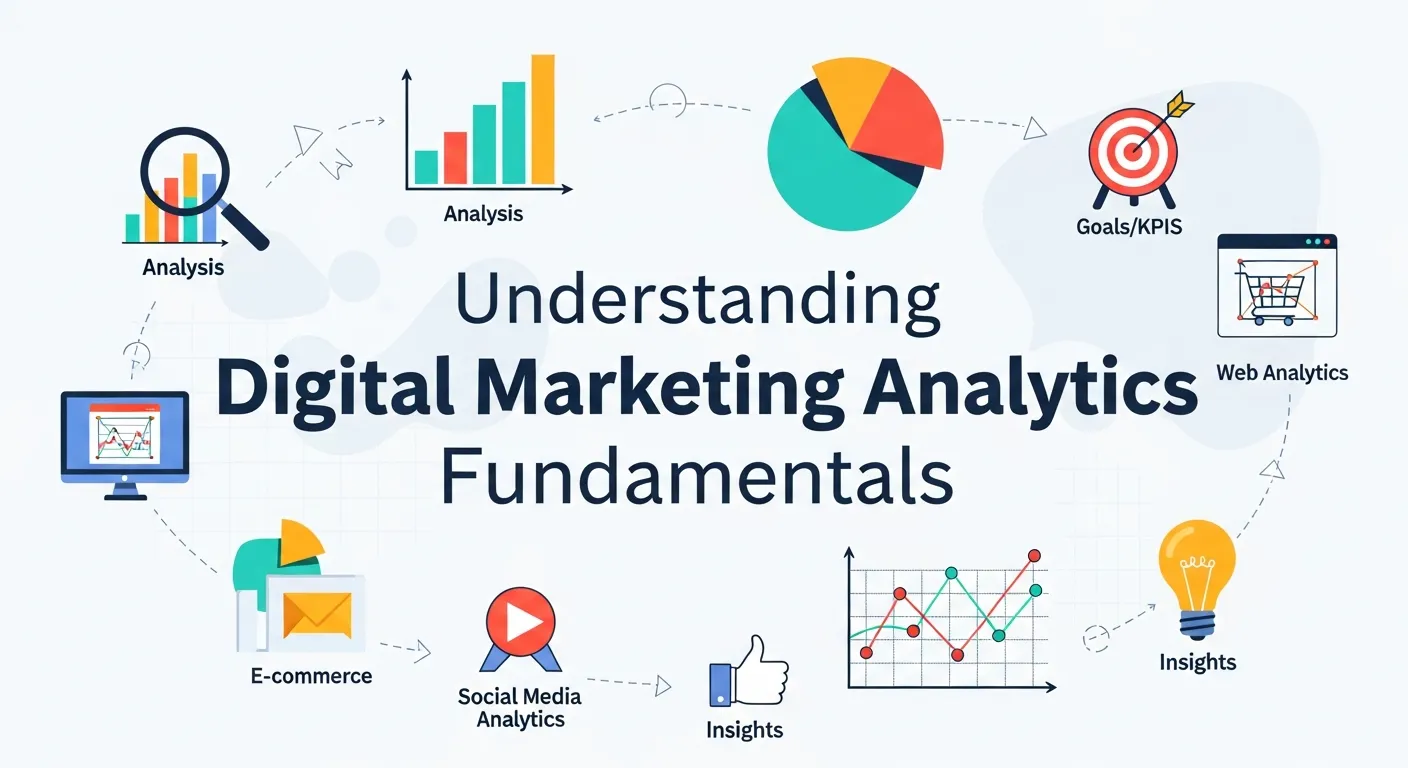
Digital marketing analytics encompasses the collection, measurement, and analysis of data from all your online marketing activities. Unlike traditional marketing where results were often difficult to quantify, digital channels provide detailed insights into customer behavior, campaign performance, and conversion paths.
The foundation of effective analytics lies in understanding the difference between metrics and key performance indicators (KPIs). Metrics are individual data points—like page views or click-through rates—while KPIs are carefully selected metrics that directly align with your business objectives. A successful analytics strategy focuses on KPIs rather than vanity metrics that look impressive but don’t drive business growth.
Modern analytics tools collect data across multiple touchpoints, creating a comprehensive view of the customer journey. This multi-channel approach reveals how different marketing efforts work together to influence purchasing decisions, enabling more sophisticated attribution modeling and budget allocation.
Essential Metrics That Drive Business Growth
Conversion Rate and Revenue Attribution
Conversion rate measures the percentage of visitors who complete desired actions, whether that’s making a purchase, signing up for a newsletter, or downloading a resource. This is especially important for sectors like finance, where strategies from financial digital marketing rely heavily on accurate attribution.
Revenue attribution helps identify which channels and campaigns generate actual sales, not just engagement. Advanced attribution models consider the entire customer journey, giving credit to multiple touchpoints rather than just the final click before conversion.
Customer Acquisition Cost and Lifetime Value
Customer Acquisition Cost (CAC) calculates the total expense of gaining a new customer. When compared with Customer Lifetime Value (CLV), businesses gain insight into profitability — a core concept also seen in digital marketing for financial services.
The CAC to CLV ratio reveals campaign profitability. A healthy ratio typically shows CLV exceeding CAC by at least 3:1, indicating sustainable growth potential.
Engagement Quality Indicators
Traditional engagement metrics like likes and shares provide limited insight into campaign effectiveness. More meaningful indicators include time spent on page, scroll depth, email open rates, and social media saves or shares—actions that suggest genuine interest rather than passive consumption.
Bounce rate, when analyzed alongside other metrics, reveals content relevance and user experience quality. High bounce rates might indicate poor targeting, slow loading times, or mismatched expectations between ad copy and landing page content. Analytics can also enhance your email performance with strategies from Marketing Analytics Hacks to Improve Your Email Open Rates.
Meaningful engagement metrics—such as time on page, scroll depth, and social media saves—help measure true audience interest. Bounce rate analysis can reveal weaknesses in experience, targeting, or landing-page quality. These insights are crucial when designing campaigns like those outlined in digital content marketing guides.
Advanced Analytics Strategies for Campaign Optimization
Multi-Touch Attribution Modeling
Single-touch attribution models credit only one interaction in the customer journey, typically the first or last touchpoint. Multi-touch attribution provides a more accurate picture by distributing conversion credit across multiple interactions based on their influence.
Linear attribution assigns equal credit to all touchpoints, while time-decay models give more weight to recent interactions. Position-based attribution emphasizes first and last touches while still crediting middle interactions. Choose models based on your typical sales cycle length and customer behavior patterns.
Cohort Analysis for Long-Term Performance
Cohort analysis exposes patterns in user behavior over time. For instance, monthly cohorts can reveal retention trends, while channel-based cohorts highlight source quality — insights that support smarter B2B digital marketing strategies.
Monthly cohorts can expose seasonal patterns, while channel-based cohorts highlight which acquisition sources produce the most valuable long-term customers. These insights inform budget allocation and campaign timing decisions.
Predictive Analytics and Machine Learning
Modern analytics platforms use machine learning algorithms to identify patterns and predict future outcomes. Predictive lead scoring assigns probability scores to prospects based on their behavior and characteristics, helping sales teams prioritize follow-up efforts.
Predictive analytics can also forecast campaign performance, identify optimal bidding strategies, and recommend content topics based on historical engagement data. These capabilities enable proactive optimization rather than reactive adjustments.
Common Analytics Pitfalls and How to Avoid Them
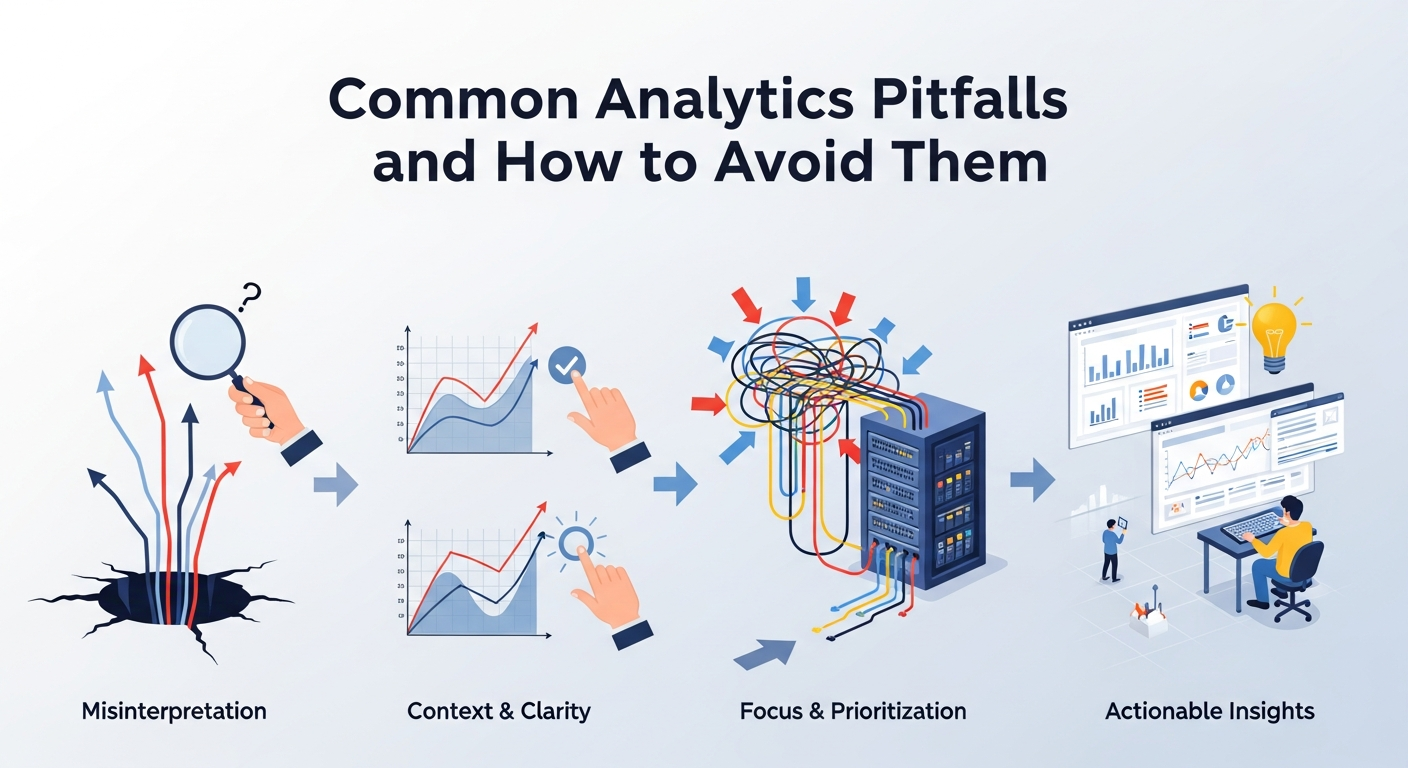
Data Quality and Attribution Challenges
Inaccurate data undermines even the most sophisticated analysis. Common data quality issues include duplicate tracking codes, missing UTM parameters, and cross-device tracking gaps. Regular data audits and standardized tracking protocols prevent these problems.
Attribution windows—the time period during which conversions are credited to campaigns—significantly impact results interpretation. Short attribution windows may undervalue channels with longer consideration periods, while extended windows can overcredit campaigns to delayed conversions.
Correlation Versus Causation Mistakes
Analytics reveals correlations between variables, but correlation doesn’t prove causation. A spike in social media engagement coinciding with increased sales doesn’t necessarily mean social media caused the sales increase. Other factors like seasonal trends, competitor actions, or external events might be the real drivers.
Controlled testing through A/B experiments helps establish causal relationships by isolating variables and measuring their specific impact on outcomes.
Overemphasis on Short-Term Metrics
Focusing exclusively on immediate results can lead to poor long-term decisions. Brand awareness campaigns might show minimal short-term conversion impact while building valuable recognition that influences future purchases. Email nurture sequences may appear ineffective based on individual message metrics but prove highly valuable when measured across the entire sequence.
Balance short-term performance indicators with long-term brand health metrics to maintain sustainable growth.
Businesses often prioritize quick wins over long-term brand building. A balanced approach improves sustainability and aligns with insights from why digital marketing is the future.
Building Your Analytics Infrastructure
Tool Selection and Integration
Choosing the right analytics tools depends on your business size, technical capabilities, and specific needs. Google Analytics provides comprehensive website tracking, while platforms like HubSpot or Market offer integrated marketing automation features.
Social media management tools like Hootsuite or Buffer include built-in analytics, but dedicated platforms like Sprout Social provide more detailed insights. For paid advertising, native platform analytics (Facebook Ads Manager, Google Ads) offer the most granular data, while tools like Supermetrics aggregate multi-platform performance.
Dashboard Creation and Reporting
Effective dashboards display relevant KPIs without overwhelming viewers with excessive data. Executive dashboards might focus on high-level metrics like revenue attribution and customer acquisition costs, while campaign managers need detailed performance breakdowns by channel, audience, and creative variation.
Automated reporting ensures consistent monitoring without manual effort. Schedule regular reports for different stakeholders, customizing content and frequency based on their roles and information needs.
Team Training and Data Literacy
Analytics tools are only valuable when team members can interpret and act on the insights they provide. Invest in training programs that teach not just tool functionality but also statistical concepts, experimental design, and critical thinking skills.
Create standardized processes for data analysis, hypothesis testing, and performance review meetings. This ensures consistent methodology across team members and prevents individual biases from skewing interpretation.
Harnessing Social Media Analytics for Smarter Engagement
Social media is no longer just a branding tool—it’s a measurable marketing channel. Social media analytics allows marketers to track engagement, audience demographics, sentiment, and campaign performance across platforms like Facebook, Instagram, LinkedIn, and TikTok. By understanding which posts resonate with different audience segments, businesses can optimize content strategy, posting schedules, and ad targeting.
For instance, analyzing metrics such as reach, engagement rate, click-through rate, and conversions helps identify high-performing content and campaigns. Sentiment analysis also reveals how customers perceive your brand, allowing proactive responses to negative feedback and amplification of positive sentiment. Integrating social media analytics with broader marketing data provides a holistic view of how social efforts contribute to business goals.
Optimizing Paid Advertising Campaigns with Analytics

Paid advertising—whether via Google Ads, social media platforms, or programmatic channels—requires data-driven optimization to maximize ROI. Analytics tracks metrics like cost per click (CPC), cost per acquisition (CPA), impression share, and conversion rate. By continuously analyzing these metrics, marketers can reallocate budgets to top-performing ads, adjust bidding strategies, and test creative variations.
Programmatic advertising, in particular, leverages machine learning and real-time data to serve ads to the most relevant audiences. Analytics ensures that automated campaigns remain efficient by identifying underperforming segments and optimizing targeting parameters. With insights from analytics, paid campaigns become not just a cost but a scalable revenue driver.
Leveraging Analytics for Content Marketing Strategy
Content marketing thrives on understanding what engages audiences and drives conversions. Analytics provides the clarity needed to craft data-backed content strategies. Metrics like page views, average session duration, scroll depth, and click-through rates indicate which content resonates and where users drop off.
Beyond individual content pieces, analytics can reveal the performance of entire campaigns or topics. For example, blog posts driving email sign-ups or lead magnet downloads highlight areas for content expansion. Over time, businesses can identify recurring patterns, refine messaging, and invest in content formats that yield the highest return. Predictive analytics can even suggest topics likely to perform well based on historical engagement trends.
Using Analytics to Improve Customer Retention
While acquisition gets much attention, customer retention is equally, if not more, important for long-term growth. Analytics can identify churn risks by tracking behaviors such as declining engagement, infrequent purchases, or inactivity in loyalty programs.
By segmenting customers based on activity and purchase patterns, businesses can deliver personalized retention campaigns. Email reminders, loyalty rewards, or targeted upsell offers can be timed to prevent churn. Cohort analysis further helps understand long-term retention trends and the lifetime value of different customer segments. Armed with these insights, businesses can proactively nurture existing customers, boosting loyalty and maximizing revenue.
Turning Data Into Strategic Advantage
Digital marketing analytics transforms raw data into strategic insights that drive sustainable business growth. The most successful organizations don’t just collect more data—they focus on the right metrics, implement robust measurement frameworks, and build cultures that prioritize data-driven decision making.
Start by auditing your current analytics setup and identifying gaps in measurement or interpretation. Implement tracking for the KPIs that matter most to your business objectives, and establish regular review processes that turn insights into action.
Remember that analytics is an ongoing process, not a one-time setup. Customer behavior evolves, new channels emerge, and business priorities shift. Maintain flexibility in your approach while building systematic processes that ensure consistent, accurate measurement.
The competitive advantage belongs to businesses that can quickly identify what works, eliminate what doesn’t, and continuously optimize their marketing efforts based on solid data foundation. Master these fundamentals, and you’ll build marketing campaigns that deliver measurable results rather than hopeful projections.
Frequently Asked Questions (FAQ) – Digital Marketing Analytics
1. How do I know which KPIs are most important for my business?
KPIs in digital marketing analytics should directly align with your overall business goals. For instance, e-commerce stores may focus on conversion rate, average order value, and customer lifetime value, while B2B companies might track lead quality and sales pipeline velocity. The key is to prioritize metrics that impact revenue and strategic objectives rather than vanity metrics like social media likes or impressions alone.
2. Can small businesses benefit from advanced digital marketing analytics tools?
Absolutely. Even small businesses can leverage platforms like Google Analytics 4, HubSpot, or Hotjar to gain actionable insights. Focus on key metrics that drive decisions, and scale analytics capabilities as your business grows. The goal is to extract meaningful insights without getting overwhelmed by data.
3. What’s the difference between predictive and descriptive analytics in digital marketing?
Descriptive analytics summarizes historical performance—what happened and when—while predictive analytics forecasts future outcomes using past patterns. Both are essential: descriptive analytics informs you of current performance, while predictive analytics guides strategic decisions and campaign optimization.
4. How often should I audit my digital marketing analytics setup?
A full audit should be done at least quarterly. However, high-traffic websites or campaigns-heavy businesses may benefit from monthly audits. Audits ensure accurate data collection, correct tracking code implementation, proper use of UTM parameters, and functioning event tracking.
5. How can I ensure my team uses digital marketing analytics effectively?
Invest in data literacy training and standardize processes for analyzing and reporting insights. Foster a culture where decisions are backed by data, experiments are documented, and cross-functional collaboration between marketing, sales, and product teams is encouraged. This ensures analytics insights translate into actionable business outcomes.
6. What’s the difference between Google Analytics 4 and Universal Analytics?
Google Analytics 4 (GA4) uses an event-based model instead of Universal Analytics’ session-based approach. GA4 offers enhanced cross-device tracking, privacy controls, and machine learning-powered insights. Since Universal Analytics stopped processing data in July 2023, GA4 is now the standard for digital marketing analytics.
7. How often should I review my analytics data?
The review frequency depends on campaign types and business cycles. Paid campaigns may require real-time monitoring, whereas organic content performance can be assessed weekly or monthly. Regular reviews help spot trends, while flexibility is key to investigating sudden anomalies immediately.
8. Which attribution model should I use for digital marketing analytics?
Attribution models depend on your sales cycle and customer journey complexity. Short-cycle businesses may rely on last-click attribution, while B2B companies with longer consideration periods benefit from multi-touch attribution. Experiment with different models to understand their impact on your campaigns.
9. How do I measure ROI using digital marketing analytics?
ROI is calculated by comparing the revenue generated from marketing activities to the cost of those activities. Use analytics platforms to track conversions, leads, and campaign expenses. This allows you to optimize budget allocation and identify the most profitable channels.
10. What role does A/B testing play in digital marketing analytics?
A/B testing allows marketers to test variations of landing pages, ads, or emails to determine which performs better. Digital marketing analytics tracks metrics such as click-through rates, conversion rates, and engagement to provide data-driven decisions for improving campaign performance.
11. How can I track customer behavior across multiple channels?
Use integrated analytics tools like GA4, HubSpot, or CRM platforms that consolidate data from websites, social media, email, and paid ads. Multi-channel tracking provides a comprehensive view of customer journeys and helps optimize campaigns for better performance.
12. What common mistakes should I avoid in digital marketing analytics?
Common pitfalls include tracking vanity metrics, relying on incomplete data, neglecting proper attribution, and failing to update tracking after website or campaign changes. Focus on actionable KPIs, accurate setup, and continuous monitoring to avoid misinformed decisions.


Leave a Reply